
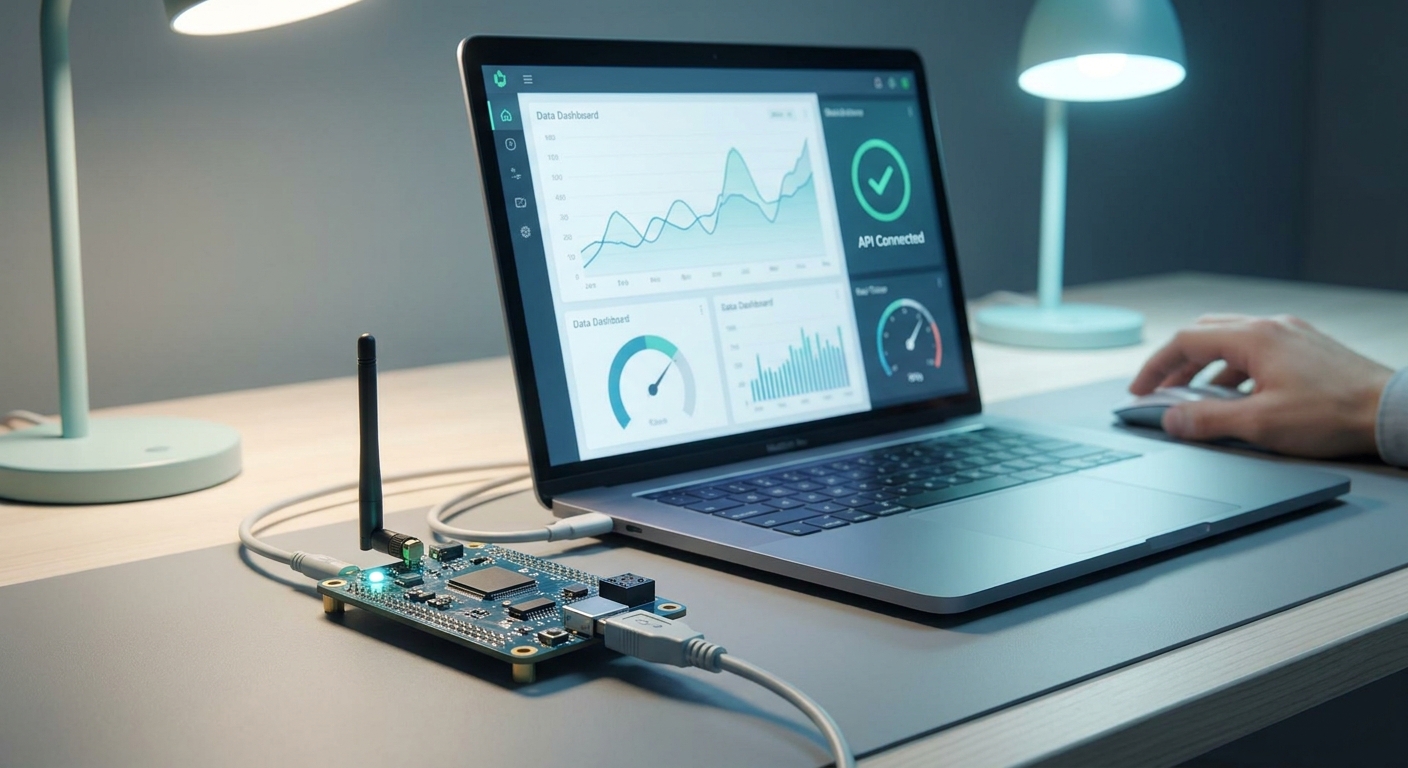
Connecting sensor data to a dashboard through an API sounds like plumbing work, but the failure points are almost always in payload mapping and auth, not the wire itself — this guide walks through both.
- Most IoT API integrations break on payload schema mismatches, not connectivity — map fields before you write code.
- REST polling works for under 50 devices; MQTT or webhooks are required past that for real-time dashboards.
- Kilo IoT exposes REST and MQTT endpoints so cold storage and building teams pull sensor data without custom brokers.
- Test with one live device reporting every 60 seconds before rolling the iot api connection out to a full site.
Why this matters
A dashboard that shows stale sensor readings is worse than no dashboard — it tells operations staff everything is fine while a cold room drifts past 8°C. The API connection between your sensors and your dashboard is the part that either keeps that data current or quietly breaks it.
Most teams treat the iot api integration as a one-time task. It isn't. Device firmware updates change payload structure, gateways drop packets during network handoffs, and rate limits get hit the moment a site adds its 51st sensor. Build the integration with those failure modes in mind from step one, in 2026 and beyond.
What you'll need
- API base URL and an authentication token from your IoT platform (Kilo IoT issues these per workspace)
- A device or gateway already reporting over LoRaWAN, mioty, or MQTT
- A sample payload from at least one live sensor — not documentation, an actual JSON packet
- Your dashboard's data model: field names, units, and expected update frequency
- A test environment or staging dashboard, so schema mistakes don't hit the production view
- 2-3 hours for the first integration; repeat sensors of the same type take under 20 minutes each after that
The steps
1. Pull your API credentials and confirm the base URL
Every request needs a token and an endpoint, and getting this wrong is the single most common reason an iot api connection returns nothing. Generate a scoped API key rather than a master key — scoped keys limit blast radius if a script leaks one.
Confirm the base URL matches your account region; a US-hosted workspace pointed at an EU endpoint returns 404s that look like auth failures. Common mistake: copying a token from documentation instead of the live account, which works in testing and fails silently in production.
2. Choose REST polling, MQTT subscribe, or webhook push
These three paths solve different problems. REST polling is simplest to build but adds latency equal to your poll interval — fine for a dashboard refreshing every 5 minutes, wrong for an alarm that needs to fire in seconds.
MQTT gives you a persistent subscription and near-instant delivery, which is why most cold storage and industrial monitoring setups use it once they pass a handful of devices. Webhooks push data to your dashboard's ingestion endpoint the moment a reading arrives — no polling loop to maintain, but you need a public endpoint that can receive POST requests. Common mistake: picking REST polling for a 200-device site because it was easiest to prototype, then rebuilding the whole pipeline six months later when latency complaints start.
3. Map the payload schema to your dashboard fields
Pull one real payload and lay it next to your dashboard's field list before writing a single line of parsing code. Sensor payloads typically carry a device ID, timestamp, and an array of readings with units attached — temperature in Celsius, humidity as a percentage, battery as millivolts.
Mismatched units cause more dashboard errors than dropped connections do. A payload reporting Fahrenheit into a dashboard expecting Celsius won't throw an error — it'll just show a wrong number that someone catches three weeks later. Common mistake: assuming every sensor from the same vendor uses an identical schema; firmware revisions change field names without warning.
4. Set authentication and respect rate limits
Most IoT APIs cap requests per minute per token — exceed it and you get throttled, not blocked outright, which means your dashboard shows gaps instead of an obvious error. Build in a backoff: if you hit a 429 response, wait and retry rather than hammering the endpoint again immediately.
For MQTT connections, authentication happens once at the connection handshake, not per message, so token expiry becomes a reconnection problem rather than a per-request one. Common mistake: hardcoding a poll interval faster than the API's documented rate limit, which works fine with 5 devices and fails at 50.
5. Build the listener — polling loop or webhook handler
For REST, this is a scheduled job that calls the endpoint, checks the response code, and writes successful reads to your dashboard's data store. For webhooks, it's an endpoint that accepts a POST, validates the payload signature if the platform provides one, and returns a 200 fast — slow responses cause the sending platform to retry and duplicate data.
Log every failed call with the raw response body, not just the status code. Common mistake: building the happy path only and never testing what happens when the sensor goes offline mid-poll — the dashboard should show "no data" clearly, not the last reading forever.
6. Parse and normalize before writing to the dashboard
Convert units, standardize timestamps to a single timezone (UTC, always), and reject payloads missing required fields rather than writing partial rows. A dashboard built on unnormalized data looks fine until someone compares two sites and the numbers don't line up because one reports local time and the other UTC.
Common mistake: trusting the sensor's onboard timestamp without checking clock drift — battery-powered sensors can drift by minutes over months without an internet time sync.
7. Wire alarms and thresholds back into the loop
Once data flows into the dashboard, connect threshold rules so an out-of-range reading triggers a notification instead of sitting on a chart no one's watching. This is where an iot api integration stops being a data pipe and becomes an operational tool — a cold storage unit holding at 9°C for 10 minutes should generate an alert, not a data point buried in a graph.
Kilo IoT's rules engine sits on top of the same API layer, so alarm logic and dashboard data share one source instead of two disconnected systems. Common mistake: setting thresholds using default values from documentation instead of the actual operating range for the specific site.
8. Test with one live device before full rollout
Run the full pipeline — sensor to API to dashboard to alarm — with a single device reporting every 60 seconds for at least a full day before connecting the rest of the fleet. This catches timezone bugs, unit mismatches, and rate limit issues while the blast radius is one sensor, not fifty.
Common mistake: testing only with sample or mock payloads and skipping the live device step, which hides schema drift that only shows up on real hardware.
Troubleshooting
- 401 Unauthorized on every call — token expired or scoped to the wrong workspace; regenerate and confirm the base URL region matches the account.
- Dashboard shows old data, no errors thrown — check the poll interval against actual API response times; a slow endpoint plus a tight interval creates a backlog that looks like a freeze.
- Some fields are null in the dashboard — payload schema changed after a firmware update; pull a fresh sample payload and re-map before assuming the API broke.
- Duplicate readings appearing — webhook retries are firing because the receiving endpoint responded too slowly; return a 200 within 2-3 seconds and process asynchronously after.
- Rate limit errors under normal load — polling interval is too aggressive for the device count; batch requests per gateway instead of per sensor where the API supports it.
- Timestamps off by hours — sensor clock drift or a timezone conversion missed in the normalization step; force UTC at ingestion, convert only at display.
Tools and resources
- Kilo IoT — REST and MQTT endpoints, LoRaWAN and mioty connectivity, and a rules engine that sits on the same data the dashboard reads
- A payload inspector or API client (Postman, Insomnia, or curl) to pull raw sample payloads before writing parsing code
- A staging dashboard separate from production, so schema changes get caught before they reach the team watching live sites
- an IoT dashboard built for cold storage temperature monitoring — a worked example of API-fed sensor data mapped to a live facilities dashboard
What to do next
Once one sensor type is integrated end to end — API, dashboard, alarm — repeat the schema-mapping step for each additional sensor type before scaling device count. The integration work per device drops from hours to minutes once the pipeline pattern is proven; the risk is always in the first payload, not the fiftieth.
FAQ
What is an IoT API used for?
An IoT API moves sensor readings from a device or gateway into a dashboard, database, or alarm system. It handles authentication, data retrieval, and often device commands, connecting hardware over LoRaWAN, mioty, or MQTT to whatever software displays or acts on the data.
Should I use REST or MQTT for my IoT dashboard?
Use REST polling for low-frequency updates on fewer than 50 devices; use MQTT once you need near-real-time delivery or the device count grows past that. MQTT keeps a persistent connection open, which cuts latency compared to repeated polling requests.
Why does my IoT API return a 401 error?
A 401 almost always means the token expired, was scoped to the wrong workspace, or the base URL points at the wrong account region. Regenerate the API token and confirm the endpoint URL matches your account before checking anything else.
How often should a sensor dashboard update?
Match the update frequency to the risk: cold storage temperature dashboards typically refresh every 1-5 minutes, while less time-sensitive metrics like humidity trends can update hourly. Faster refresh intervals increase API call volume and can hit rate limits if not accounted for.
Can I connect an IoT API directly to threshold alarms?
Yes, and it is the more useful setup than a dashboard alone. Wiring the same API feed into a rules engine means an out-of-range reading, like a cold room holding above 8°C for 10 minutes, triggers a notification instead of sitting unnoticed on a chart.
What causes duplicate sensor readings in a dashboard?
Duplicate readings usually come from webhook retries: if the receiving endpoint responds slowly, the sending platform assumes the delivery failed and resends the same payload. Returning a fast 200 response and processing data asynchronously fixes most duplicate issues.
Do I need a separate integration for each sensor type?
Each sensor type needs its own payload schema mapping since field names, units, and structure vary even within the same vendor's product line. The API connection and authentication setup are typically reusable across sensor types once built.
One last thing
The integration that fails in production almost never fails at the API call — it fails at the unit conversion three steps later, when a sensor reporting Fahrenheit gets written into a dashboard built for Celsius and nobody notices until a temperature log gets pulled during an audit. Check units before you check connectivity.