
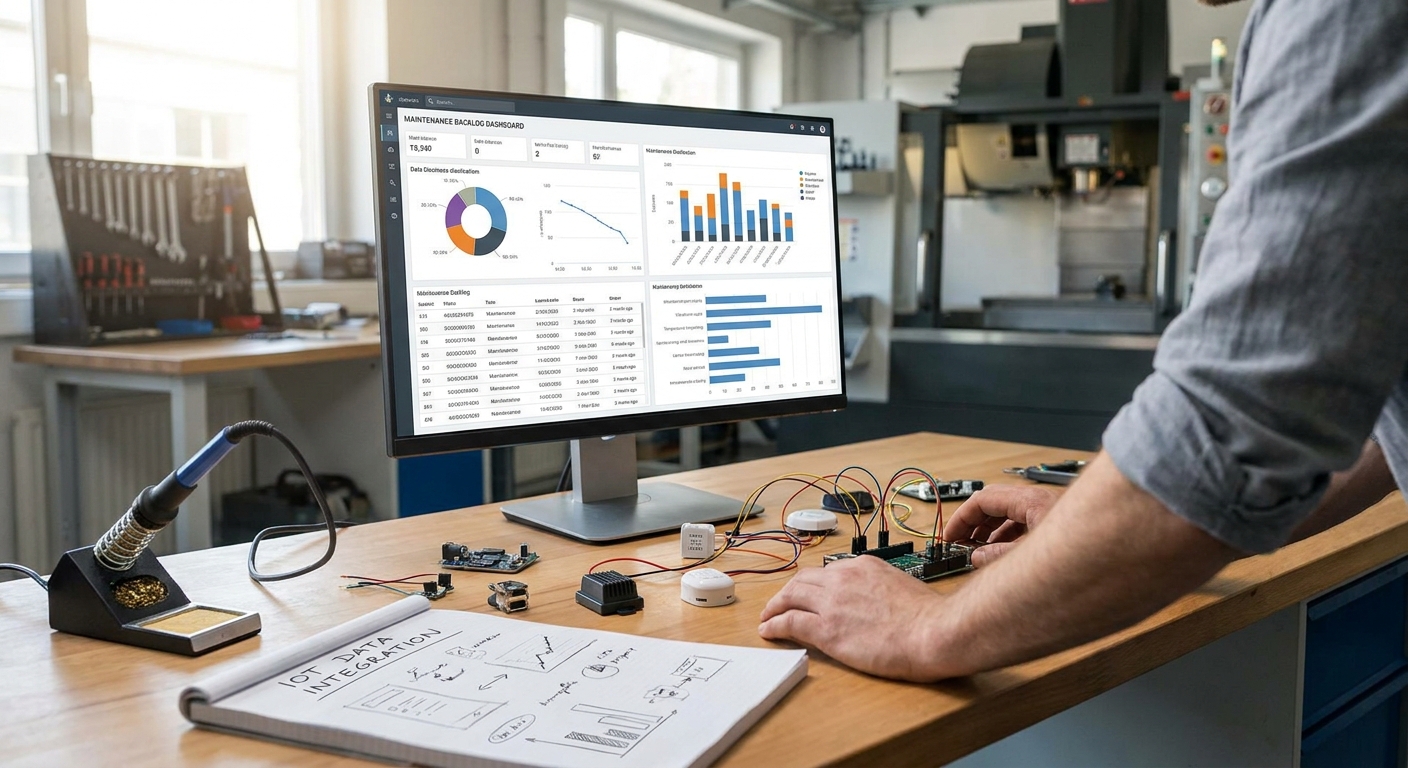
A maintenance backlog dashboard turns raw sensor readings into a ranked list of what's broken, what's about to break, and who owns the fix — built directly from LoRaWAN, mioty, or MQTT data instead of a spreadsheet somebody updates once a week.
- Building a maintenance backlog dashboard in 2026 needs live sensor feeds, a rules engine, and an escalation path — not just a chart.
- A visual rules engine with CEL expressions and version control turns a threshold breach into a tracked backlog item, not a one-off alert.
- Five alarm severity tiers keep a stuck door sensor from burying a compressor failure on the same screen.
- Pilot on a Free plan (0 EUR, up to 5 devices, 1 dashboard, 1 rule) before scaling to Starter at 25 EUR per month for 25 devices.
What Is a Maintenance Backlog Dashboard?
A maintenance backlog dashboard is a live view of every open fault, threshold breach, or overdue inspection across a site, ranked by severity and age instead of buried in a spreadsheet or a technician's notebook. It pulls from the same sensor data used for real-time alarms — vibration on a pump, temperature in a walk-in freezer, differential pressure across a filter — and turns each breach into a trackable line item with a timestamp, an owner, and a status.
The difference from a plain sensor dashboard is the backlog logic: items don't disappear when the reading returns to normal, they stay open until someone closes them out. The Kilo IoT Platform builds this on top of its own LoRaWAN and mioty network server plus an MQTT connector, so backlog logic sits on data you're already collecting rather than a parallel system you have to stand up in 2026.
What You Need Before You Build a Maintenance Backlog Dashboard
- A connectivity layer that already talks to your sensors — LoRaWAN, mioty, or MQTT, so you're not running a separate network server per protocol
- A rules engine that can evaluate conditions over time, not just a single-point trigger
- Alarm severity tiers so a low-battery notice and a chiller failure don't compete for the same attention
- A place to route the alarm once it fires — email, SMS or push to the people who respond, plus the REST API for whatever system maintenance already uses
- Dashboard widgets that show status at a glance: a chart for trend, a gauge for current value, a floor-plan pin for location
By 2026, most facilities teams already run wireless sensors alongside an older BMS or PLC network — the dashboard needs to read both, not force a rip-and-replace.
How Do You Build a Maintenance Backlog Dashboard From IoT Data?
1. Map Failure Modes to Data You Can Actually Collect
Start with the fault list your team already tracks on paper: compressor overheat, filter differential pressure, a door left open, vibration on a bearing. For each one, name the sensor and the exact threshold that should open a backlog item — a reading of 8°C for 10 minutes on a reach-in cooler means something very different from a single spike. ISO 55000, the international standard for asset management, frames this as tying a physical asset to a measurable condition of failure before you touch a dashboard tool at all. Skip this step and the dashboard fills with noise nobody trusts by month two.
2. Connect the Sensors and Existing Equipment Feeds
Bring in the wireless sensors first — LoRaWAN or mioty devices report on their own schedule without needing a gateway per device. Then pull in anything already wired: PLCs, energy meters, and building management systems typically speak Modbus, and connecting Modbus PLCs to a cloud IoT dashboard means you're not running a second dashboard just for equipment that predates the wireless rollout. The goal is one data layer, not three.
3. Build the Device Inventory and Digital Twin
Every sensor needs a digital twin — a record of what it's attached to, where it sits, and what normal looks like — before its readings mean anything on a backlog list. A live 3D building twin with sensors bound to objects turns "sensor 4471 is over threshold" into "chiller 2, mechanical room B is over threshold," which is the difference between a ticket someone acts on and one they scroll past.
4. Write the Rules That Create Backlog Items
This is where the dashboard becomes a backlog and not just a live feed. A rules engine built on BPMN with CEL expressions lets you write a condition like "vibration RMS above threshold for three consecutive readings," version it, and roll it back if it starts misfiring. Designing a rules engine workflow for multi-site facility alarms covers structuring rules so one bad sensor doesn't take down alerting for an entire site. Step-through debugging against a test payload catches a bad threshold before it goes live, not after it pages a technician at 2 a.m.
5. Set Severity Tiers and Escalation Chains
Not every backlog item deserves a text message. Five severity tiers, each with its own escalation chain, let a "filter needs changing next week" item sit quietly in the inbox while a "freezer over threshold" item pages a technician, then their supervisor, then a site manager if nobody acknowledges it in time. Quiet hours keep low-severity items from waking anyone overnight — they still land in the centralized inbox by morning.
6. Design the Dashboard Widgets Around Backlog Age
A backlog dashboard needs different widgets than a real-time monitoring screen: a table sorted by open duration matters more than a live chart alone. Combine a chart widget for trend, a gauge for current reading, and floor-plan pins so a facilities manager sees which building and floor without decoding a device ID. Sort by days-open, not severity alone — a medium-severity item open for three weeks is a bigger operational risk than one that opened an hour ago.
7. Push Backlog Data to the Systems Your Team Already Uses
A backlog item isn't useful sitting in a browser tab nobody has open. REST and gRPC APIs with scoped API keys let whatever ticketing or reporting tool maintenance already runs day to day read backlog data straight from the platform — alarm history, sensor readings and device state, pulled on its own schedule. A rule fires the alarm and escalates it; the ticketing tool pulls it over the API, so nothing the team already uses has to be replaced.
8. Review the Backlog Weekly and Tune the Rules
A backlog dashboard drifts if nobody owns it. A weekly quarter-hour where a facilities lead reviews items open past 30 days, closes what's actually fixed, and tunes rules that fired too often — or not at all — keeps the list trustworthy. NFPA 70B, the standard for electrical equipment maintenance programs, treats this kind of periodic review as part of the maintenance program itself, not an afterthought.
Pilot a Backlog Dashboard Free
0 EUR for up to 5 devices, 1 dashboard and 1 rule — no card required.
Common Maintenance Backlog Dashboard Problems and Fixes
- Duplicate backlog items for the same fault. A rule without hysteresis re-fires every time the sensor crosses the threshold in either direction. Add a "for N consecutive readings" condition and a cooldown before the rule can re-trigger.
- Alarms fire but nothing gets closed out. No owner was set in the escalation chain, so the alert lands in a shared inbox nobody checks. Assign a named first-response tier before the item escalates to a supervisor.
- Sensor offline gets logged as a fault. A dead battery or a gateway outage looks identical to a real threshold breach if the rule doesn't separate "no data" from "bad data." Write a separate rule for device silence and route it at a lower severity.
- Low-severity items bury the critical ones. Everything gets tagged the same tier because nobody built a severity structure. Rebuild tiers around actual consequence — safety and product loss at the top, cosmetic issues at the bottom — and reducing false alarms in industrial IoT alert systems covers the tuning process in more detail.
- The backlog never shrinks. Items get created but nobody reviews or ages them out. Sort the dashboard by days-open by default, not severity alone, so stale items surface on their own.
Tools and Data Sources for a Maintenance Backlog Dashboard
- Wireless sensors on LoRaWAN or mioty for anything not already wired — vibration, temperature, differential pressure, door contacts
- An MQTT connector for PLCs, energy meters, and BMS feeds already running on site
- A rules engine with CEL expressions and version control so backlog logic gets tested before it goes live
- Dashboard widgets — chart, gauge, map, and floor-plan pins — configured around the fault types mapped in step one
- A device inventory or digital twin per asset, so a backlog item resolves to a physical location, not a device ID
- An AI assistant that can build a rule or set an alarm threshold from a plain-language request, scoped to the signed-in user's permissions and confirming before it deploys anything — Kilo's assistant works this way rather than acting unattended
What to Do After the Dashboard Is Live
Once the backlog dashboard is running on real data, the next question is usually whether the deployment paid for itself — sensor cost, install labor, and avoided downtime against what the backlog actually caught. That's a separate calculation from building the dashboard itself, and it's worth running once you have a few months of real backlog history rather than guessing before launch.
FAQ
What is a maintenance backlog dashboard used for?
A maintenance backlog dashboard tracks every open fault or overdue inspection across a site, ranked by severity and age, so fixes happen by risk instead of by who complained loudest. It replaces a spreadsheet or whiteboard list with a view built directly from live sensor data.
How is a maintenance backlog dashboard different from a CMMS?
A maintenance backlog dashboard creates and prioritizes items from live sensor readings; a CMMS tracks the work order once a technician is assigned. Most teams connect the two by letting the CMMS pull alarm data over the API rather than replacing either system.
What sensors feed a maintenance backlog dashboard?
Vibration, temperature, humidity, differential pressure, and door-contact sensors on LoRaWAN or mioty cover most mechanical and facility faults, and an MQTT connector pulls in readings from PLCs, energy meters, and building management systems already on site. The exact mix depends on the failure modes mapped before building the dashboard.
How much does it cost to build a maintenance backlog dashboard in 2026?
On the Kilo IoT Platform, the Free plan covers up to 5 devices, 1 dashboard, and 1 rule at 0 EUR with no card required, enough to pilot a backlog dashboard on one piece of equipment. Scaling past that moves to Starter at 25 EUR per month for up to 25 devices, with gateways unlimited on every tier.
Can a maintenance backlog dashboard run without a dedicated BMS?
Yes — a backlog dashboard built on wireless sensors and an MQTT connector doesn't need a building management system underneath it. Sensors report directly to the cloud platform and rules do the threshold work a BMS would otherwise handle.
How do you stop a maintenance backlog dashboard from flooding people with alarms?
Separate severity tiers so only genuinely urgent faults page someone immediately, and add a consecutive-reading condition to rules so a single noisy data point doesn't open a backlog item. Quiet hours and escalation chains route low-severity items to a morning review instead of a phone at 2 a.m.
Does a maintenance backlog dashboard need a digital twin?
It doesn't strictly need one, but a digital twin — a record of what each sensor is attached to and where it sits — turns a device ID into a location a technician can act on immediately. Without it, backlog items read like a sensor number instead of a named piece of equipment in a specific room.
What happens to backlog items for equipment without sensors yet?
They stay manual until a sensor gets added — most teams keep a parallel manual entry field on the same dashboard so partial sensor coverage doesn't mean running two separate systems. The next equipment to get sensors usually follows the same failure-mode mapping used for equipment already connected.
What Most Backlog Dashboards Get Wrong
Most teams build the alarm layer and skip the aging logic, so items get created but nothing forces a review. The backlog dashboards still in use past month three of 2026 are the ones where days-open is the default sort column, not severity. That one setting decides whether the list becomes a working to-do list or a graveyard nobody opens.