
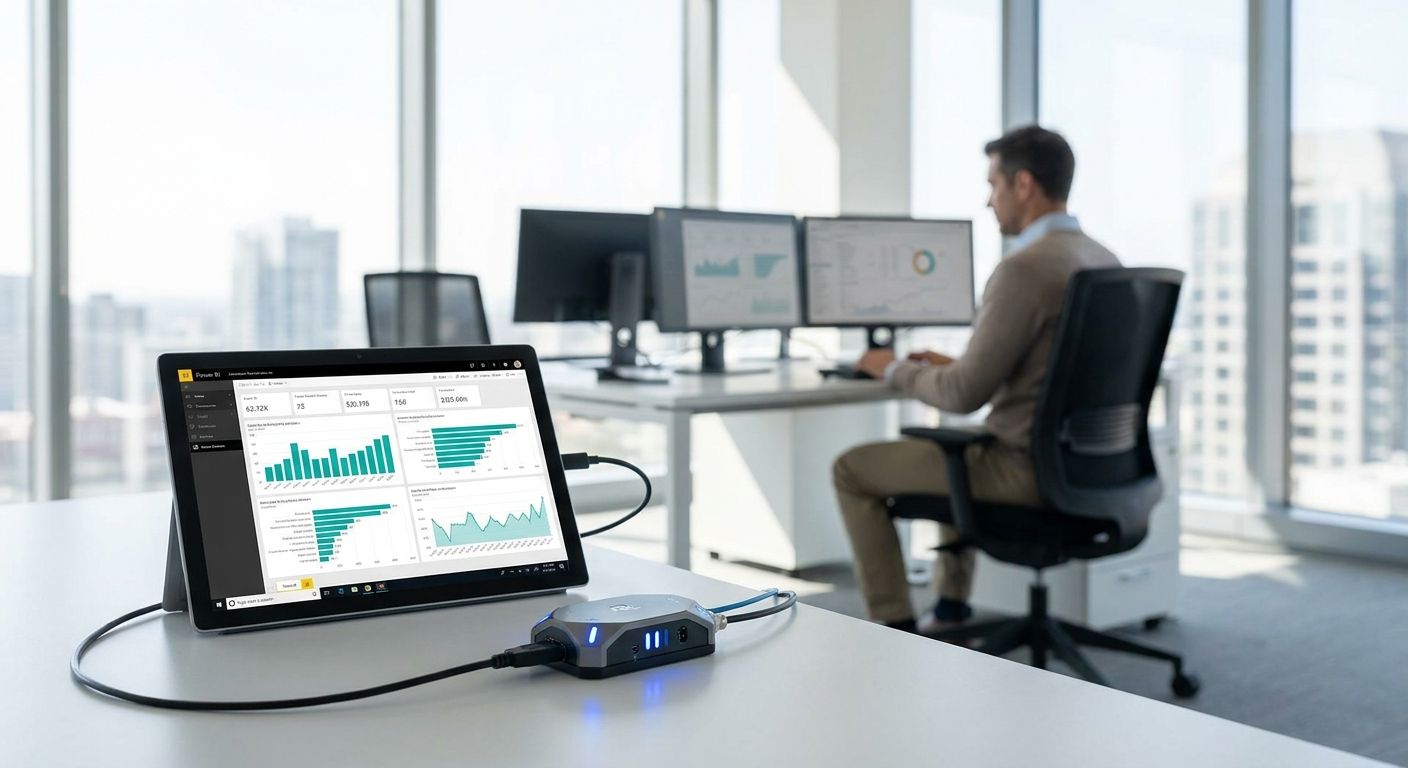
Power BI and Tableau don't talk to LoRaWAN or mioty sensors directly. They talk to APIs, databases, and webhooks, and getting temperature, vibration, or tank-level readings from the field into either tool takes a specific pipeline, not a plug-in. This guide walks through building that pipeline in 2026, from generating a scoped API key to scheduling the refresh that keeps the dashboard current.
- Pull sensor data into Power BI or Tableau via REST API — no native connector exists for LoRaWAN or mioty devices in 2026.
- Power BI Pro caps scheduled refresh at 8 times per day; Premium raises that to 48, per Microsoft's own documented limits.
- A scoped, read-only API key keeps the integration auditable and limits exposure if a credential leaks.
- Route alarms through the platform's rules engine instead of polling for anomalies inside Power BI or Tableau.
- A free IoT platform tier with a 5-device cap is enough to build and test the pipeline before wiring in a full site.
Why connect IoT sensor data to Power BI or Tableau
Most operations and facilities teams already have a rules engine and a live dashboard for alarms inside their IoT platform. The Kilo IoT Platform handles that layer natively — device telemetry, threshold rules, and escalation chains all live in one place. But finance, executive reporting, and cross-department analytics usually run in Power BI or Tableau, alongside energy bills, occupancy figures, and maintenance spend that never touch an IoT platform at all.
Blending sensor telemetry with that existing BI layer means the facilities lead doesn't rebuild a chart from scratch every time someone on the leadership team wants cold-storage temperature trends next to utility cost. It also means the IoT platform stays the system of record for real-time response, while Power BI or Tableau becomes the system of record for trend and compliance reporting.
What you need before you integrate IoT sensor data with Power BI or Tableau
- A workspace with device telemetry already flowing in, via LoRaWAN, mioty, or an MQTT connector from a PLC or BMS
- A scoped REST or gRPC API key with read access to the specific devices or dashboard views you're exporting
- Power BI Desktop with the Web connector, or Tableau Desktop / Tableau Prep with the Web Data Connector (WDC) framework
- A clear schema: device ID, timestamp with timezone, metric name, unit, and value
- A couple of hours for the first pull, plus time to validate the numbers against the live IoT dashboard before anyone screenshots a chart for a board deck
How to integrate IoT sensor data with Power BI or Tableau: step by step
1. Map the data model before you touch either tool
List every metric you're exposing — temperature, humidity, vibration RMS, tank-level percentage, door-open events — with its unit and expected range. BI tools flatten everything into rows and columns; if one sensor reports Celsius and another Fahrenheit, or two sites use different tank-level units, the report misjoins quietly. Skipping this step is the most common way a unit mismatch ends up on a director's desk in 2026.
2. Generate a scoped API key
Create an API key scoped to the specific devices or dashboard views you're exporting, not a full-account key. An ABAC-based access model lets you restrict a key to read-only telemetry for one site or one device group, so a BI integration never carries write access to alarms or rules. Reusing an admin-level key meant for device provisioning is the mistake that turns a reporting project into a security incident.
3. Pick your connection method: pull, push, or bridge
Three real paths exist. Pull: schedule Power BI's Web connector or a Tableau WDC to call the REST API on an interval. Push: use the platform's rules engine to fire a webhook on a schedule or event, landing rows in an intermediate database that Power BI or Tableau reads natively — see the general pattern in how to integrate IoT sensor data with your dashboard via API. Bridge: if telemetry already comes in over MQTT from PLCs or a BMS, point Power BI or Tableau at the downstream database directly instead of double-polling the API — the same logic applies if you're starting from Modbus PLCs feeding a cloud IoT dashboard.
4. Build the query or Web Data Connector
In Power BI, use Get Data > Web, point at the REST endpoint, and pass the API key as a header rather than a query parameter so it doesn't end up cached in query history. In Tableau, write a WDC against the same endpoint, or connect through Tableau Bridge if the endpoint sits on a private network. Parse the JSON response into columns matching the schema from step 1. A hardcoded date filter that silently truncates history after a few months is a common, hard-to-spot mistake here.
5. Set the refresh schedule and respect the platform's limits
Power BI Pro datasets cap scheduled refresh at 8 times per day; Premium capacity raises that to 48 times per day, per Microsoft's published limits. For a tank-level trend or a door-open frequency chart, hourly refresh inside the Pro cap is usually tight enough — anything faster belongs in the live IoT dashboard, not a BI report. Tableau Cloud and Tableau Server extract schedules are configured per site, so confirm your site's admin settings before promising a refresh cadence you can't hit.
6. Validate against the live dashboard before publishing
Pull the same time window in both places and check for parity, especially around gaps from offline sensors or gateway downtime. A device's digital twin view shows last-seen timestamps, which is the fastest way to tell whether a missing data point in Power BI or Tableau is a pipeline bug or a real sensor outage.
7. Publish with access controls that match the source
Set row-level security or user filters in Power BI or Tableau that mirror who has access to which sites in the IoT platform. Publishing a workspace-wide dashboard because it's faster than setting filters is how a single-site facilities report ends up exposing every location to a viewer who should only see one.
“If the refresh cap tops out at 8 times a day, the BI dashboard is a trend report, not an alarm system.”
Common problems when connecting IoT sensor data to Power BI or Tableau dashboards
- Timestamps off by hours — normalize to UTC in the query and convert to local time only in the visual.
- Refresh fails silently after hitting the 8-per-day Power BI Pro cap — move to Premium capacity or stagger metrics across two datasets.
- Duplicate rows after pagination — check the query loop for a next-page token instead of assuming a fixed page count.
- Null values from offline sensors showing as zero — flag missing readings using the device's last-seen timestamp rather than treating a gap as a zero, which is dangerous on a tank-level or vibration chart.
- API key stops authenticating after rotation — store the credential in Power BI's data source credential manager or a saved Tableau connection, never hardcoded in the query text.
- Units mismatch across sites — standardize the unit at the API layer or add a conversion step before anything gets averaged across locations.
Tools and connectors for IoT-to-Power-BI and IoT-to-Tableau pipelines
- REST and gRPC APIs — the primary data source for the pull method described above; REST covers most BI integrations, gRPC suits system integrators building faster streaming pipelines elsewhere.
- Power Query / Web connector (Power BI) and Web Data Connector (Tableau) — built into both tools, no extra licensing required for a REST-based pull.
- An intermediate database (Postgres, Azure SQL, or similar) — worth adding once you're moving more than a handful of metrics, since it decouples the BI refresh schedule from the platform's live rules engine.
- MQTT connector for PLCs and BMS feeds — if telemetry already flows in over MQTT for other reasons, check that the connection is configured correctly; see how to secure MQTT connections for industrial IoT deployments before exposing that data downstream.
- Kilo Electronics (kiloelectronics.com) — the sister hardware store that ships LoRaWAN and mioty sensors worldwide, for sites that don't have devices deployed yet to generate the readings in the first place.
Test the pipeline before you scale it
Free plan covers up to 5 devices, no card required, full platform.
What to do after your Power BI or Tableau dashboard is live
Once the numbers match, decide what stays in the IoT platform and what moves to BI. Real-time alarms, multi-step escalation, and quiet hours belong in the rules engine — rebuilding that logic inside Power BI or Tableau means maintaining two sources of truth for the same threshold, and the refresh cap makes it slower to react anyway. Power BI and Tableau earn their keep on trend analysis, cross-site comparison, and the reports that go to people who never log into the IoT dashboard directly.
FAQ
Does Power BI have a native connector for IoT sensor data?
No, Power BI has no native connector for LoRaWAN or mioty telemetry as of 2026. Use the built-in Web connector to pull data from the IoT platform's REST API on a schedule.
How often can Power BI refresh an IoT dashboard?
Power BI Pro caps scheduled dataset refresh at 8 times per day; Premium capacity raises that to 48 times per day. Anything requiring faster updates belongs in the IoT platform's live dashboard, not a BI report.
Is Tableau or Power BI better for IoT sensor dashboards?
Both connect to IoT sensor data the same way, through a REST API pull or a Web Data Connector. The choice usually follows whichever BI tool the organization already standardizes on, not a difference in IoT compatibility.
What API does an IoT platform need to support for a Power BI or Tableau integration?
A REST API with token-based authentication covers most Power BI and Tableau integrations. A gRPC API is useful for system integrators building faster streaming pipelines alongside the BI connection.
Can I get real-time alerts in Power BI or Tableau instead of using the IoT platform's rules engine?
Not reliably. Power BI's 8-refresh-per-day cap on Pro capacity means an alert could sit unseen for hours; a threshold rule and alarm escalation chain inside the IoT platform responds immediately instead.
Do I need a database between my IoT platform and Tableau?
Not for a small integration, but it helps at scale. An intermediate database decouples the BI refresh schedule from the platform's live rules engine once you're moving more than a handful of metrics.
How do I secure an IoT-to-Power-BI or Tableau integration?
Use a scoped, read-only API key tied to specific devices instead of a full-account credential, and store it in the BI tool's credential manager rather than hardcoding it in a query.
The refresh gap most teams miss when they integrate IoT sensor data with Power BI or Tableau
A cold-chain excursion at 2 a.m. doesn't wait for a scheduled refresh. If the Power BI dataset is set to pull once every three hours to stay under the 8-per-day Pro cap, the exec dashboard might not show that excursion until well after the fact — while the platform's rules engine and alarm escalation already sent an SMS or email the moment the threshold crossed. Keep time-critical response in the IoT platform. Keep Power BI and Tableau for the trend line nobody needs to see in the first five minutes.